Checking job health across all businesses (owner's view)
Who this guide is for: the platform OWNER side (platform operators) — not customer staff. Businesses' own administrators see their own queues in their own workspace; this is the cross-business operational view.
This read-only view answers one question: is any business's outbound-message queue blocked, resting, or piling up dead letters — right now? Every fact below is an answer from the real route; a supplementary browser run also drove the owner console that renders it (final section, with its honest standing — including one open backend defect).
The example businesses are synthetic. The three businesses in the run ("Blocked Co", "Light Co", "Quiet Co") and every queued message were seeded by the test. No live WhatsApp/Meta message was sent, no live worker was racing the reads, and no real customer's queue was ever read. The owner bearer in the run was a synthetic platform-admin credential — the same fail-closed gate contract, not a real CapCore-issued token.
Evidence record (kept for honesty)
(The body above is owner guidance; the receipts below are the internal record.)
The FULL3747-PG lane executed the mounted job-health suite against a real,
ordinary (non-superuser, NOBYPASSRLS) throwaway PostgreSQL 16 cluster over
real loopback HTTP, on the combined candidate (routes mounted in app.ts):
- Suite 8 —
platform-job-health.test.ts: 6/6 passed, started 2026-10-24T23:23:07Z, ended 2026-10-24T23:23:20Z, exit code 0. Verbatim TAP receipt:tools/zcode-integration3723/runtime/FULL3747-PG/logs/08-jobhealth.tap(preserved in the PG lane worktreeC:/CT-ZC-FULL3747, git-ignored). - A second independent cycle on a fresh cluster re-ran the same suite
6/6 green (
c2-08-jobhealth.tap); the PG lane ledger records "CYCLES 1+2 COMPLETE AND GREEN" at 2026-10-24T23:44:30Z (C:/CT-ZCODE-FULL3747/lane-pg-ledger.json). - Adjacent mounted P17-continuation suites passed in the same lane:
channel halt-expiry 9/9 (
logs/09-haltexpiry.tap) and template-block expiry 9/9 (logs/10-tblockexp.tap) — the per-channel guard surfaces this job-health view sits beside. They are cited here as mounted-and-green neighbours, not documented as journeys in this guide. - Browser journey 5 — honest status: FAILED at its entry expectation, with
the substance separately proven and one backend defect open. The
SHA-bound journey
platform-mounted job health reads and drills without
  issuing a retry
expected the owner console's entry to demand a factor step-up; the mounted candidate's platform reads (GET /v1/platform/orgsand the job-health reads) never call the platform MFA step-up that sibling platform routes apply. API probes in the lane: an owner token without the factor header got 200 on both routes (the job-health answer showing the drill business's backlog: pending 4 / claimable 3 / resting 1 / DLQ 1); a non-owner token got 401CAPCORE_ADMIN_SESSION_REQUIRED. This is reported as backend defect FULL3747-B-01 (suggested merge: call the step-up exactly as/v1/platform/review-queuedoes, after owner verification, in/v1/platform/orgsand the job-health guard). A supplementary run (SUP-J5, recorded as supplementary evidence, not the SHA-bound spec) then drove the real owner console end-to-end and passed — see the final section. Ledger:C:/CT-ZCODE-FULL3747/lane-browser-ledger.json.
Evidence standing: this is combined-candidate, local evidence — the
routes are mounted in the candidate's app.ts (the run proved the exact
exported router over real HTTP with a fail-closed replica of the owner-gate
contract; the app's own mount wires the real gate). Chief acceptance and
publication are OPEN. Nothing here is a claim about a live or Main-built
deployment.
The two reads
| Read | What it returns | Refusals |
|---|---|---|
GET /v1/platform/job-health |
Every business, worst backlog first | 401 without a valid owner bearer; 403 for a verified-but-unlisted subject; 503 DB_UNAVAILABLE when the database is down |
GET /v1/platform/job-health/{orgId} |
One business's full row | Same gate; 404 for an unknown or malformed org id |
Both answers carry Cache-Control: no-store — a health answer is a
point-in-time fact and is never cacheable.
What each row tells you — and what it deliberately never tells you
Each business's row has four blocks, all read under that business's own
tenant pin (PostgreSQL FORCE RLS; the run proved the app role is
rolsuper=false, rolbypassrls=false):
- backlog —
pending(all queued sends), split intoclaimable(the worker's claim query can take it now) andresting(a bounded retry backoff deadline is still ahead), plusoldestPendingAt/oldestPendingAgeSeconds. In the run, the heavy business's oldest pending was backdated 2 hours and the row answeredoldestPendingAgeSeconds >= 7100. - deadLetter —
failedanduncertaincounts mirroring the tenant's own review queue, withtotalandoldestAt. - retries —
pendingWithRetriesandmaxPendingRetryCount, reflecting the automatic transient budget only (retry count is capped at 3 by constraint). - throughput —
dispatched, a lifetime count without a time window.
The aggregate answer repeats the per-org counts in totals
(orgs, pending, claimable, resting, deadLetter) and orders the org
list worst-backlog-first: in the run, the business with 3 claimable +
2 resting pending came first, the single-claimable business second, and the
never-queued business last with all-zero backlog.
Privacy separation (asserted by the run): the answer text contains no recipient, no template, no payload, and no idempotency key — seeded sentinel values for both recipient and template were searched for in the serialized aggregate and detail answers and were absent. The route reads counts and ages only.
The honesty notes, verbatim
Every answer returns the route's own notes array unchanged — six notes in the run. The first five, exactly as returned:
backlog.pending is the W1 outbox truth (send_intents status='pending') at read time — not a live provider probe. pending splits into claimable (no retry_after deadline ahead — the worker's claim query can take it) and resting (a bounded transient backoff deadline is still in the future, per ZC-1354 A-012).
A growing oldestPendingAgeSeconds with claimable > 0 is the blocked-tenant signal: work exists and nothing systemic rests it. A resting backlog is deliberate provider backoff, not a stall.
deadLetter mirrors the existing tenant review queue exactly: failed + uncertain send_intents (db/messaging.ts listReviewQueue). The human-approved retry stays the TENANT's own POST /v1/outbox/:intentId/retry; this platform surface is read-only and exposes no retry action.
retries.pendingWithRetries/maxPendingRetryCount reflect the automatic transient budget only (retry_count is capped at 3 by constraint); a platform operator never resets it here.
Aggregate counts and ages ONLY: no recipient, template, payload or idempotency key is read, logged or returned (P17 separates privacy-sensitive message content from operations dashboards).
The sixth note states that dispatched is a lifetime count and that every
per-org row is read under the org's own tenant pin with no RLS bypass
anywhere.
The gate refuses before it reads
The run proved the refusal order with the database deliberately switched off:
- No bearer at all → 401. A wrong bearer is equally 401.
- A verified bearer that is not a listed platform admin → 403.
- Only a verified, listed owner reaches the database; if the database is
then unavailable, the answer is 503
DB_UNAVAILABLE— never a half-answer.
Crucially, the gate refusal wins even when the database is down: with the database unavailable, a missing bearer still got 401 and an unlisted subject still got 403 in the run. Nobody learns anything about queue state before they are fully authorized.
Open defect, honestly recorded (FULL3747-B-01): the browser lane found that the composed candidate applies no platform MFA step-up on
GET /v1/platform/orgsor the job-health reads (verified owner gate only), while sibling platform routes do demand it. Until that step-up is merged, the console's entry can never raise the owner factor prompt the workspace flow expects. The API-level gate contract above (401/403/503, fail-closed) is what the PG suite proved and is unaffected; the missing piece is the additional factor step-up on top of it.
The owner console through the real screen — supplementary proof (SUP-J5)
The browser lane's supplementary run drove the real owner console in real Chromium on the same mounted candidate:
- Entry raised no factor prompt and no owner re-check card — the recorded honest consequence of defect FULL3747-B-01 above (the step-up the workspace flow expects is never demanded).
- The platform navigation entry appears for the owner; opening it renders the console root and the businesses list (no refusal card).
- Drilling into the seeded business opens its detail page with the backlog block rendered — the same worst-backlog facts the API returns.
- Back returns to the businesses list.
- Zero writes: the run counted every non-read request to any
/platform/path — the total was 0. The console is as read-only as the API beneath it.
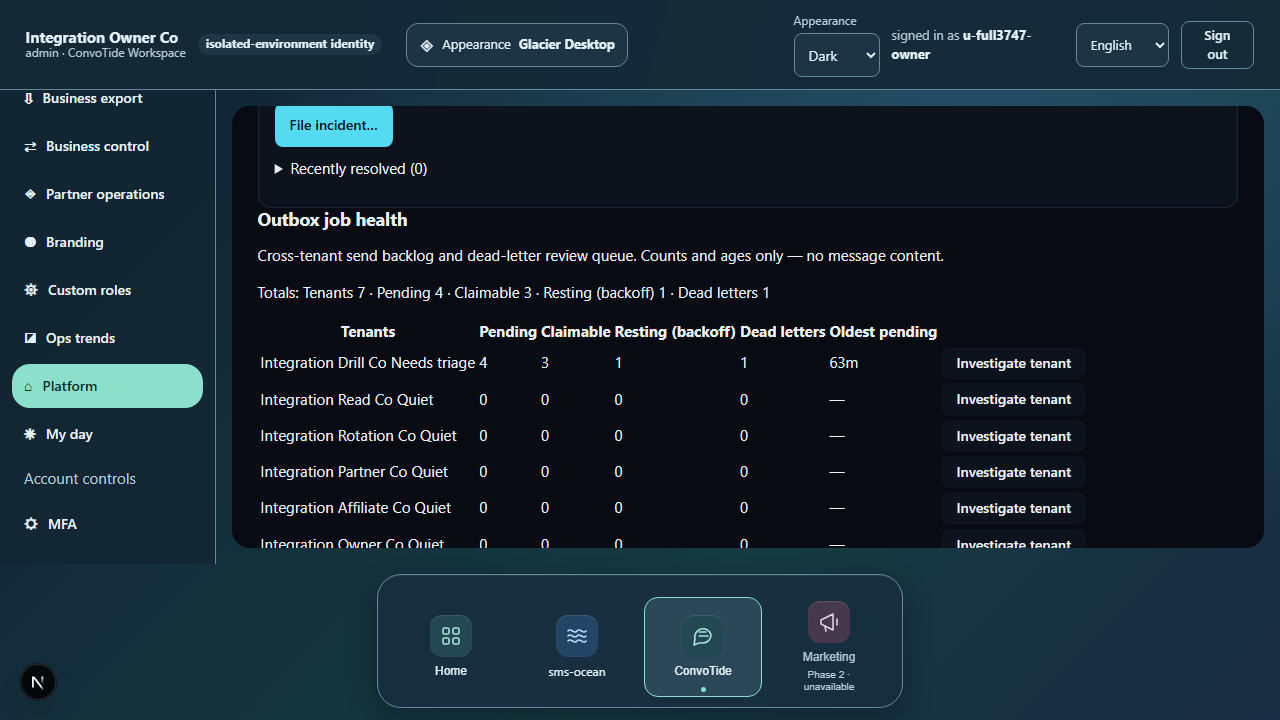
The screenshot is a byte-exact capture of the supplementary passing run (SHA256 and provenance in assets/ASSETS-MANIFEST.json). It is supplementary evidence — the SHA-bound journey 5 remains FAILED at its entry expectation and backend defect FULL3747-B-01 stays open. The seeded businesses and queue states are synthetic.
What this view is not
- It is read-only. The only retry path is the tenant's own
POST /v1/outbox/:intentId/retry; a platform operator has no retry button here. - It is not a live provider probe — it reports the outbox truth at read time, not WhatsApp/Meta's current state.
- It has no websocket surface in the evidence behind this guide; the owner-console rendering claimed here is the supplementary SUP-J5 run only, with the SHA-bound journey 5 FAILED at entry (defect FULL3747-B-01 open).
- The run seeded the queue states exactly; no live worker was racing the reads. The state-machine values (pending/resting/failed/uncertain) are the real outbox columns, observed through the real role and RLS.